Math Made Easy: Problem of the Day 132
In many of my articles, I try to stress the importance of drawing pictures. Even in higher mathematics, diagrams of the situation are critical to understanding the problem. In many cases, they can be used as the sole means of solving the problem. They are so crucial, in fact, that my multi-variable calculus professor graded our final solely on our ability to graph a given (insanely difficult to graph) three-dimensional function. That particular function took me the entire test period to graph, and even in the last few minutes, though I knew exactly what it was, I found my diagram failing to truly represent the object, so I quickly scribbled a sentence declaring what I knew it to be, hoping that would garner me a few more points on the exam (thankfully, it did).
Looking at this problem, it seems a diagram is the perfect means to solve it. There is no need whatsoever for computation.
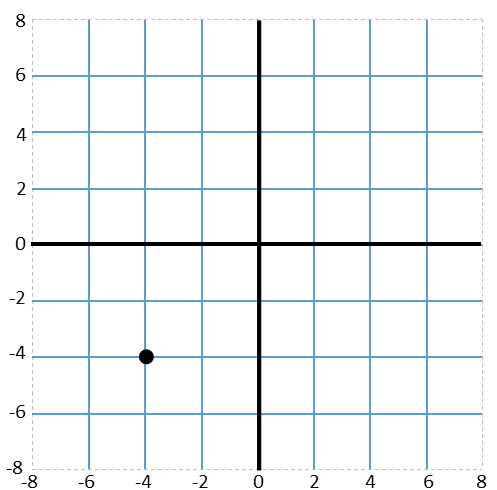
Let us graph what we know. First, we see that we are given one point on the function. f(-4) = -4 means that the point (-4,-4) exists on our function. So we plot that point.
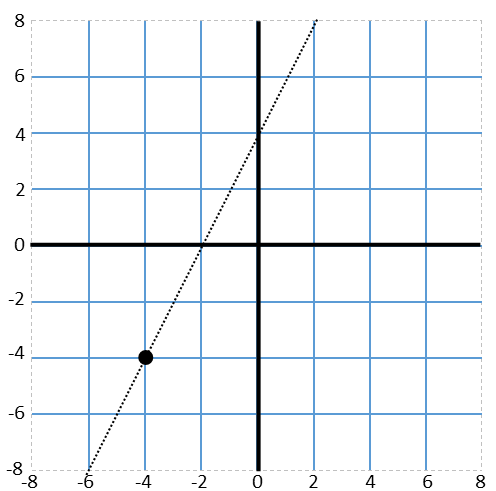
Next, we note that we’re given an inequality for the derivative of the function. A derivative is a rate of change. It tells us how quickly the function is changing. With it, we can determine the slope of the function at any given point. If we’re told the derivative is greater than something over a given interval, we know that, at any given point in that interval, the slope will be higher than that – the function will be increasing more rapidly than that. Here, we’re told that the slope is NEVER bigger than 2. So, at no point will the function rise more than 2 units while moving 1 unit to the right. If we graph a line with a slope of 2 going through our point, we’ll find the absolute maximum increase the function ever experiences.
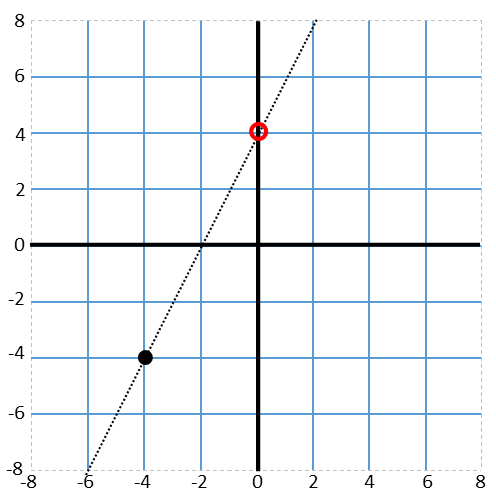
With that line in place, we acknowledge that, if the function never increases faster than that line, that, to the right of our plotted point, the function does not exist above that line. So the largest possible value at the function for any given point to the right exists on that line (to the left of the point, the function exists solely above that line, so the line represents the smallest possible value on that side). So to find the largest possible value of f(0), we simply look for the y-intercept of that line. We circle it, and, reading the graph, we see the largest possible value of f(0) is 4.
Can we have done this mathematically? Absolutely. Recognizing again that the derivative is a slope, and for this function, the maximum slope, we can write the point-slope form equation for the line using the slope of 2 and the point (-4,-4). In case you’ve forgotten, point-slope form looks like this:

The variables with subscripts are the coordinates of our known point and m is our slope. So our point-slope form of our line with our given information is:

We can put it in slope-intercept form if we like, but we don’t need to do so. To find the maximum value for f(0), we can use this equation by plugging in zero for x and solving for y:

And we get the same thing we found by graphing. So you can use either technique. I personally find that, for this situation, graphing was a much simpler and more rapid solution, and only required remembering some fundamental physical meanings of a derivative. So don’t forget to draw a picture! You will save yourself time and trouble in the long run.
|